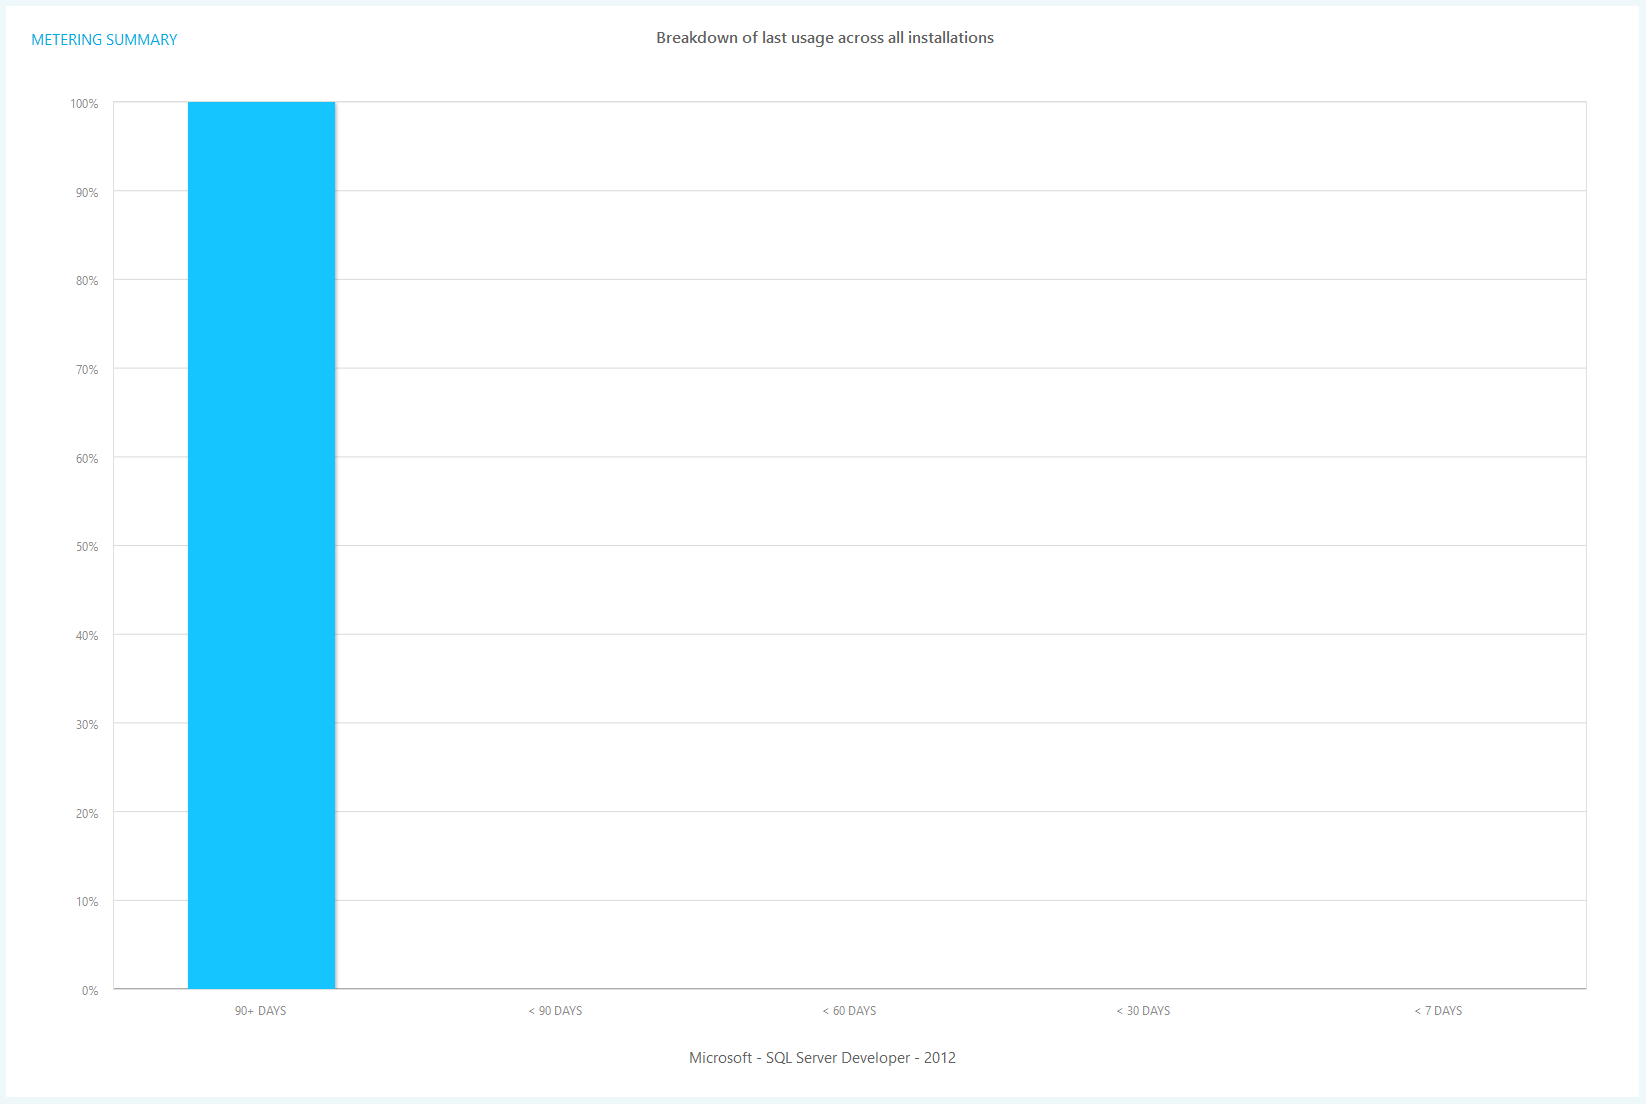
Breakdown Of Last Usage Across All Installations Chart
The Breakdown Of Last Usage Across All Installations chart displays a breakdown of the length of time since a product was last used. The average length of time is split into 5 periods.
- The percentage of product installations used in the last 7 days.
- The percentage of product installations used in the last 30 days.
- The percentage of product installations used in the last 60 days.
- The percentage of product installations used in the last 90 days.
- The percentage of product installations that have not been used in the last 90 days.
This chart is shown when you drill down from the days elapsed since last usage chart. You can use Dashboard Settings to change the number of displayed columns. You can drill into the data. You can also launch Software Metering reports for each column in the table.
Right click on any bar in the chart for drill and report options:
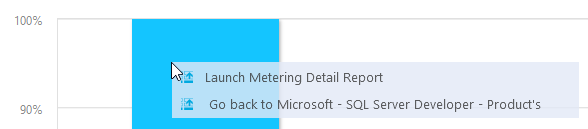
- Click Go back to... to go back up to the chart from the previous drill down.
- Click Launch... to launch the associated report.